This page shows information on your account such as:
- Your account quota for users, sessions and devices - click here to read more
- Aggregated data for your organisation. Such as, daily usage data of the app broken down by device and content - click here to read more
- Success factors, including feedback and self assessment surveys - click here to read more
Account Details
This is for view purposes only and cannot be changed as they form part of your commercial agreement with us.
There are three key bits of information:
- Number of users registered and the maximum users you are allocated
- Total number of sessions run and the maximum sessions you are allocated
- Number of devices activated and the max devices you are allocated

Analytics
We currently have two sections dedicated to analytics: Platform Usage and Success Factors.
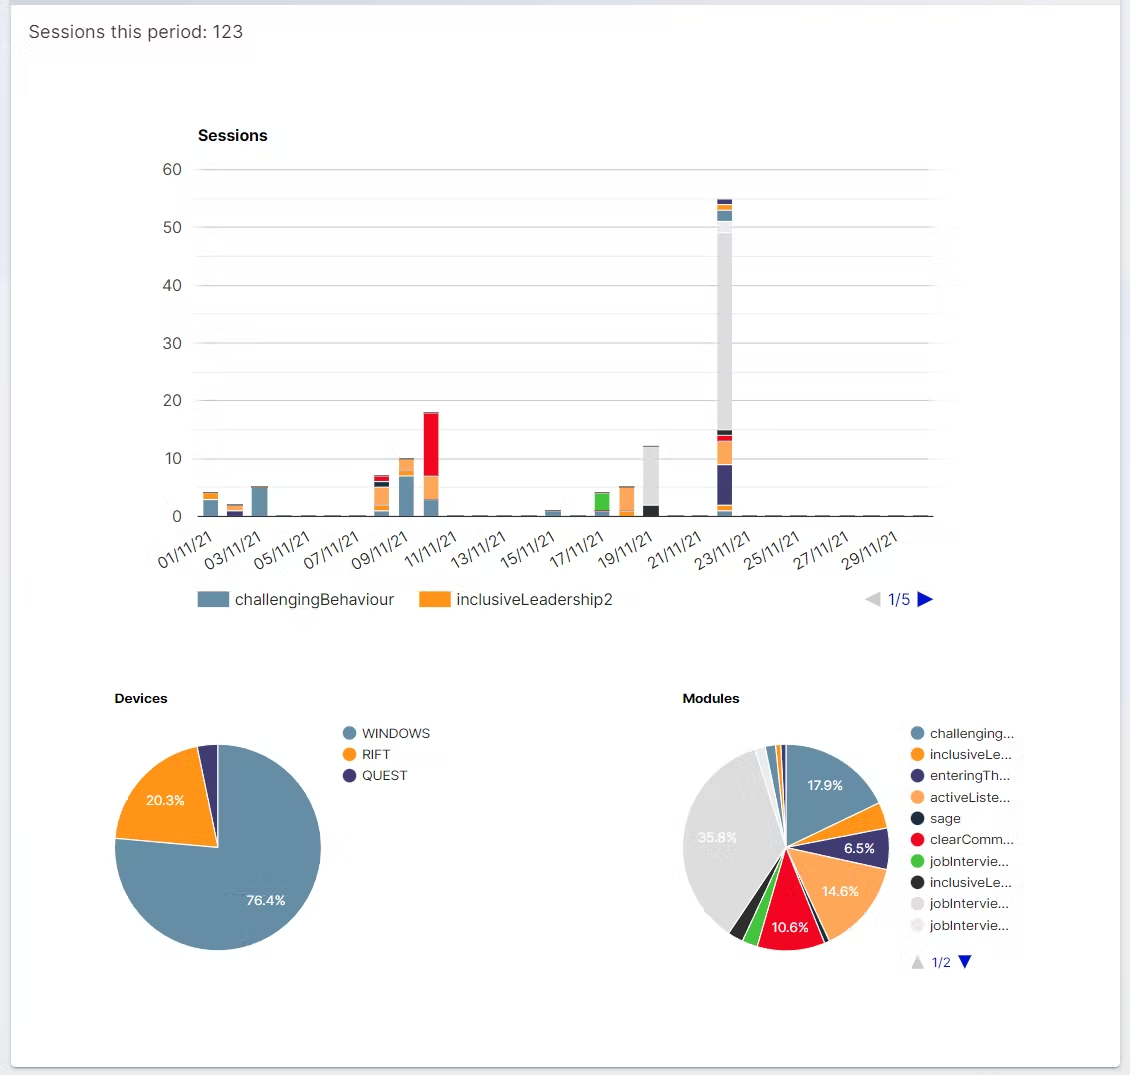
Platform Usage
Shows you the basic usage of your content over time, such as:
- Number of sessions per day
- Breakdown of which devices and modules have been played
Adjust the dates shown by clicking on the date range and select the start and end dates in the date picker as shown in the image below.
Success Factors
Success factors shows you more detailed statistics on how learners have found the content. These are based on survey data that is presented to the learner in the app.
This data can be drilled down into by module and date - which is changed via the drop down selector at the top.
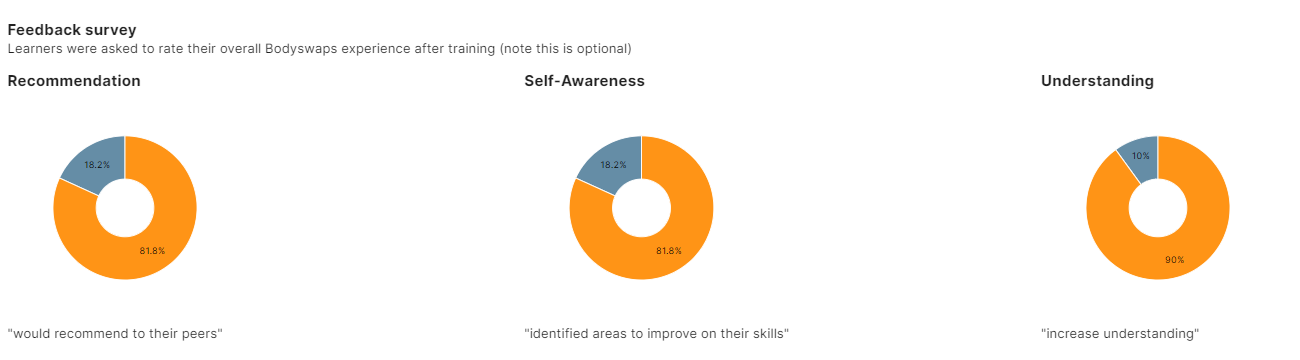
Feedback survey
The top section shows general satisfaction with the experience. Note that this survey is optional. Users are asked to rate their experience on the following, from 1 to 10:
- Recommendation / Advocacy: 'Would recommend to their peers'.
- Self-Awareness: 'Identified areas to improve their skills'.
- Understanding / Comprehension: 'Increase understanding'.
Scores of 7 or above are rated as positive and 6 or below as negative.
You can see the number and percentage of users that have answered positively (in orange) and negatively (in blue) by hovering the mouse on the circular graphs.
The three questions are standardized across all our modules.
Self Assessment survey
Here the learners were asked to self-assess their confidence/abilities both before and after completing the module. They provide a score between 1-5 for a number of questions - which are different depending on the module played.
The graphics here show the proportion of learners that gave a positive score (4 or above) before compared to after.
Example:
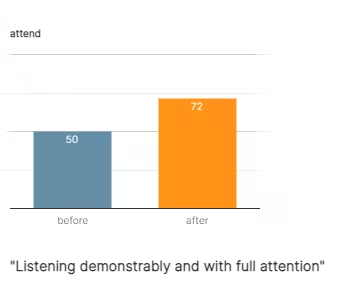
In the image above, 50% of learners were confident before, but 72% of learners were confident after completing training.